
KPI alphabet soup: Defining acronyms of high-performance dairies
Four KPIs that have considerable impact on dairy productivity and profitability are income over feed cost, dollars per pound of dry matter, energy-corrected milk efficiency and money-corrected milk.
Interpreting dairy key performance indicators (KPIs) have you feeling like eating an alphabet soup sandwich? While there are hundreds of ways to slice and dice dairy metrics, this article will define and explore several KPIs that have a substantial impact on dairy productivity and profitability. Don’t let the ostensible letter jumble deter you – the following KPIs can serve as a quick gauge and provide clarity to a mishmash of dairy data.
CAUTION: Before we continue, it must be established that KPIs and benchmarks are not necessarily synonymous. While benchmarks can be helpful for determining how your dairy stacks up to the neighbors, your KPI target should not necessarily be equivalent to regional benchmarks. Target KPIs should be carefully considered as a business decision with input from trusted advisers and should be based on the individual dairy’s goals, strengths, limitations, market conditions, debt position, etc.
Income over feed cost (IOFC)
There is a reason that IOFC is listed first here, as it is one of the most critical KPIs related to the profitability of the dairy. The calculation for IOFC is simply:
$ Income per cow – $ Feed cost per cow = IOFC
IOFC is an insightful tool for evaluating the financial health of the dairy. It can be thought of as the dollars left over to cover other expenses such as labor and supplies. Additionally, IOFC can provide some clarity when appraising nutrition decisions, such as the effects of a change in feedstuffs or inclusion of an additive. For example, let’s consider a situation where a dairy is considering feeding an additive that costs 5 cents per head per day and consistently improves milk yield by 2 pounds (Table 1). The dairy is receiving $18 per hundredweight of milk and feed costs of $7.70 per head per day.
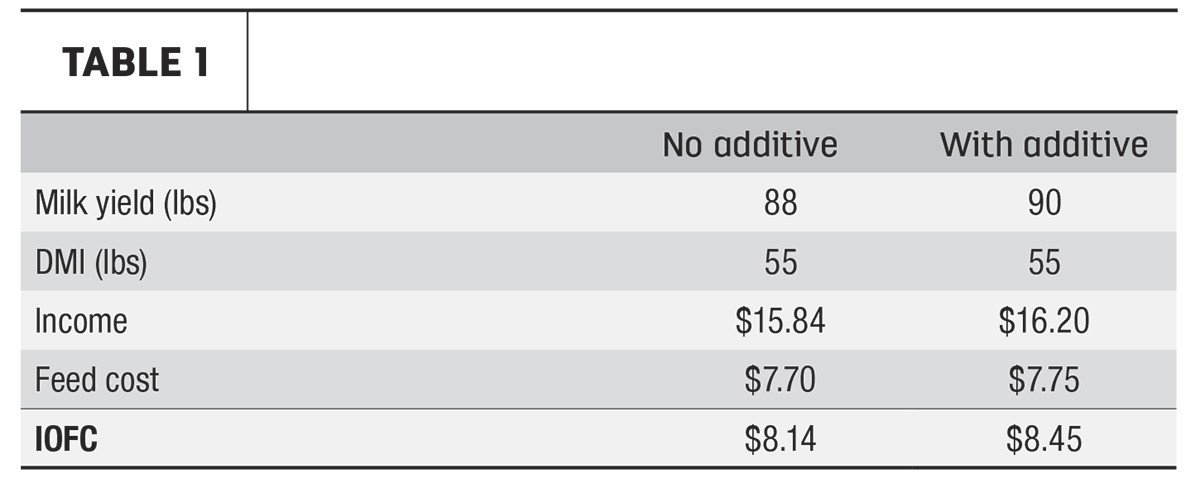
In this case, the inclusion of the additive makes good financial “cents” – a 5-cent investment yields 36 cents, or a return on investment (ROI) of 6.2 to 1. This is reflected simply as an improvement of 31 cents of IOFC ($8.45 – $8.14).
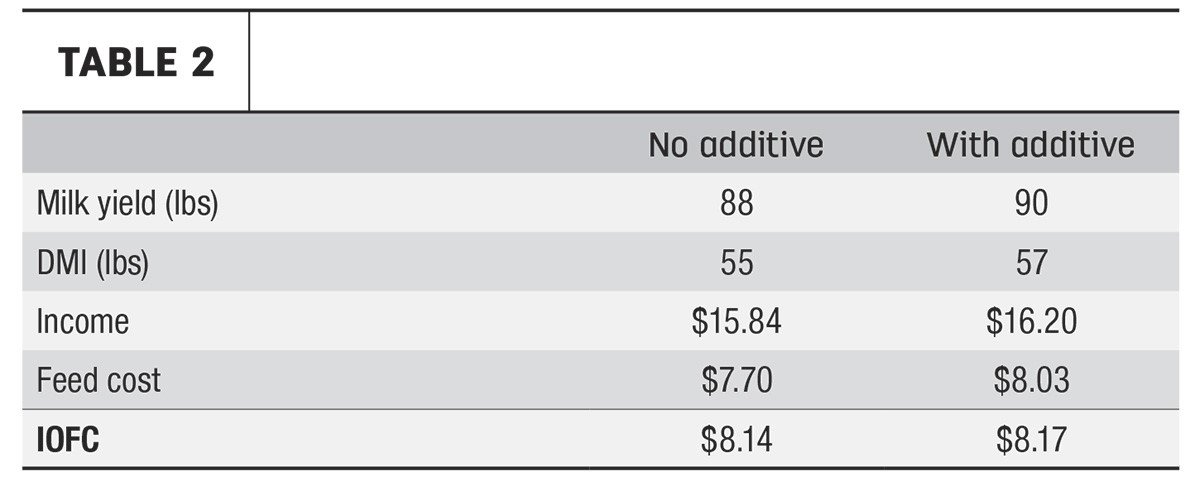
What if the additive also spurred on 2 additional pounds of intake, adding another 28 cents in feed cost? In this case, the additive would yield only a 3-cent improvement in IOFC, or an ROI of 0.09 to 1 (Table 2). While the income from additional milk looks impressive at first glance, the rest of the equation is illuminated by a marginal improvement in IOFC, which highlights its usefulness as a KPI.
Goal-range IOFC is a moving target which ebbs and flows with changing market conditions (both milk price and feed costs). Therefore, IOFC is a metric that should be tracked consistently from month to month. It may also be helpful to track what is called “indexed IOFC,” which holds a consistent milk price each month. This is particularly useful when IOFC is applied to assessment of feed changes like described above, where fluctuations in milk price could lead to misleading conclusions on the product’s financial benefit.
A more in-depth IOFC calculator, including milk price, feed cost and indexed IOFC computations, may be downloaded here.
Dollars per pound of dry matter
Dollars per pound of dry matter (DM) is a prudent way to think about feed costs, in that it standardizes the amount per unit of feed being considered – fluctuations in dry matter intake (DMI) can cause significant swings in cost per head per day, though dollars per pound of DM is constant provided ingredient cost is unchanged. Dollars per pound of DM is calculated by:
$ Feed cost per head per day
––––––––––––––––––––––– = $ / lb DM
Dry matter intake
In the example above, the initial dollars per pound of DM would be $7.70 per 55 pounds = 14 cents per pound of DM. Whether the cows are consuming 55 pounds or 57 pounds of DM, dollars per pound of DM remains 14 cents. Target dollars per pound of DM will vary with changes in ingredient costs. Though this metric provides an excellent “baseline” to help filter out the noise in feed costs resulting from changes in DMI, it does not ultimately determine profitability, i.e., if milk yield does not increase concurrently with increasing DMI. This is what makes the next KPI to be discussed so insightful.
Energy-corrected milk (ECM) efficiency
Next up in the KPI soup, ECM efficiency is an excellent metric for evaluating the productivity of the dairy because it encompasses several predominant factors: milk yield, milk components (fat and protein) and DMI. ECM efficiency provides a snapshot of the proficiency with which milk and components are produced relative to the amount of feed the cows eat. Consequently, this concept may be related back to IOFC in that cows consuming less dry matter (feed cost), but producing the same amount of milk (income) would have a greater ECM efficiency and IOFC.
To calculate ECM efficiency, one must first determine ECM, which normalizes milk yield relative to component percentages. ECM should be calculated using the following equation:
(0.327 X Milk lbs) + (12.95 X Fat lbs) + (7.65 X Protein lbs) = ECM
BEEP BEEP BEEP: We interrupt this article to bring you this important public service announcement – not all ECM equations are created equal. Corrected milk equations have a long history of attempting to standardize milk weights based on the energy content of milk of a certain composition. (Dr. Mary Beth Hall of the U.S. Dairy Forage Research Center details the history of these developments in a recently published paper.) As such, many equations have been derived through the years, and several are still in use (all purporting to be “ECM”). The equation used above corrects to 3.5% fat and 3.2% protein, while others use 3.5% and 3%. The equation above contains an adjustment factor so that true protein may be used as the input rather than crude protein, which is not generally reported anymore. Confusing, right? The point is, different ECM equations yield different results, so it is prudent to understand which is being used.
OK, now back to our regularly scheduled programming. ECM efficiency is calculated by simply dividing by DMI:
ECM lbs
–––––––––– = ECM Efficiency
DMI lbs
Let’s continue with the example in the first section to calculate ECM efficiency for the dairy, assuming 3.9% fat and 3.15% protein for an ECM of 95.3 pounds:
96.6 lbs ECM
–––––––––––– = 1.76 ECM Efficiency
55 lbs DMI
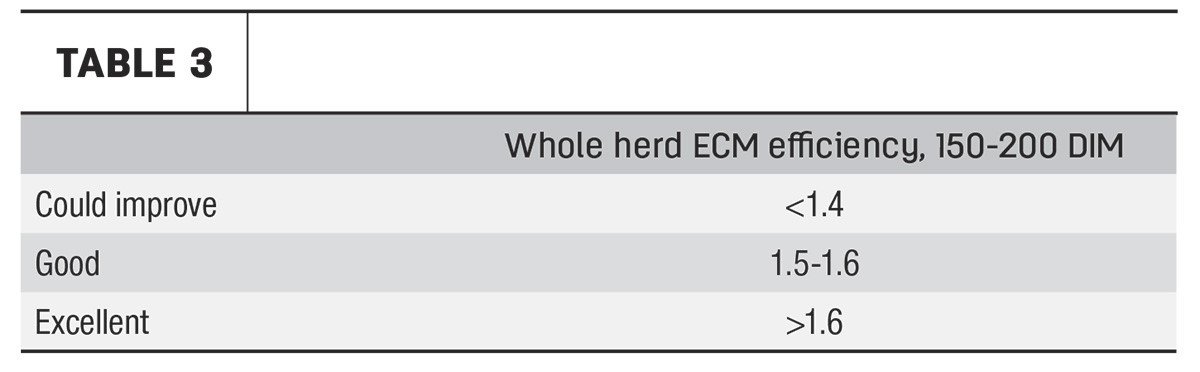
Phrased another way, this means that the herd is producing 1.76 pounds of ECM for every pound of feed consumed. For reference, this would be an excellent whole-herd ECM efficiency; some general guidelines are listed in Table 3.
Money-corrected milk (MCM)
MCM, also known as Revenue Milk, is a unique KPI in that it incorporates milk yield, milk components and their monetary value into a single metric. MCM can be thought of similarly to ECM, except with the dollar value of components providing “weight” to the final value.
MCM is calculated by first determining the difference in milk component values from standardized values of 3.5% fat, 3% protein and 5.7% other solids. Second, based on pay prices for each component, the dollar values of the differences are determined. Third, these dollar values are converted to “pounds” based on price per hundredweight of the milk check and are added to initial milk yield.
Let’s walk through an example calculation continuing with our fictional herd, making some assumptions on milk pricing:
Step 1: Determining $ value of components compared to base values:
(3.9% – 3.5%) X 90 lbs X $2.80/lb Fat = $1 of Fat Value
(3.15% – 3.0%) X 90 lbs X $1.20/lb Protein = $0.135 of Protein Value
(5.75% – 5.7%) X 90 lbs X $0.07/lb Other Solids = $0.003 of Other Solids Value
Step 2: Converting $ value of components to milk pounds
$1 Fat Value
––––––––––––––––– = 6.6 lbs
$15.10 / 100 lb Milk
$0.135 Protein Value
––––––––––––––––––– = 0.89 lb
$15.10 / 100 lb Milk
$0.003 Other Solids Value
–––––––––––––––––––––– = 0.02 lb
$15.10 / 100 lb Milk
Step 3: Adding Equivalent “Milk” pounds to yield
90 lbs + 6.6 lbs + 0.89 lb + 0.02 lb = 97.5 lbs MCM
In this case, the example dairy’s MCM equals 97.5 pounds and was most significantly impacted by the strong butterfat % and pay price. Including MCM in your repertoire of KPIs may be beneficial for those of us in Class III milk markets, as it is the only KPI of those discussed here reflective of milk component pricing relative to performance.
Calculating these KPIs is one thing, and strategies to improve them are another. This article would span many, many more pages to detail them all but could be distilled down to three primary categories: good management, good feed and good cows. So while you continually strive to improve in these areas, let the alphabet soup of KPIs above serve as signposts along your dairy’s path to success. And don’t forget, “Soup is a reminder that good things take time and patience.”
")